
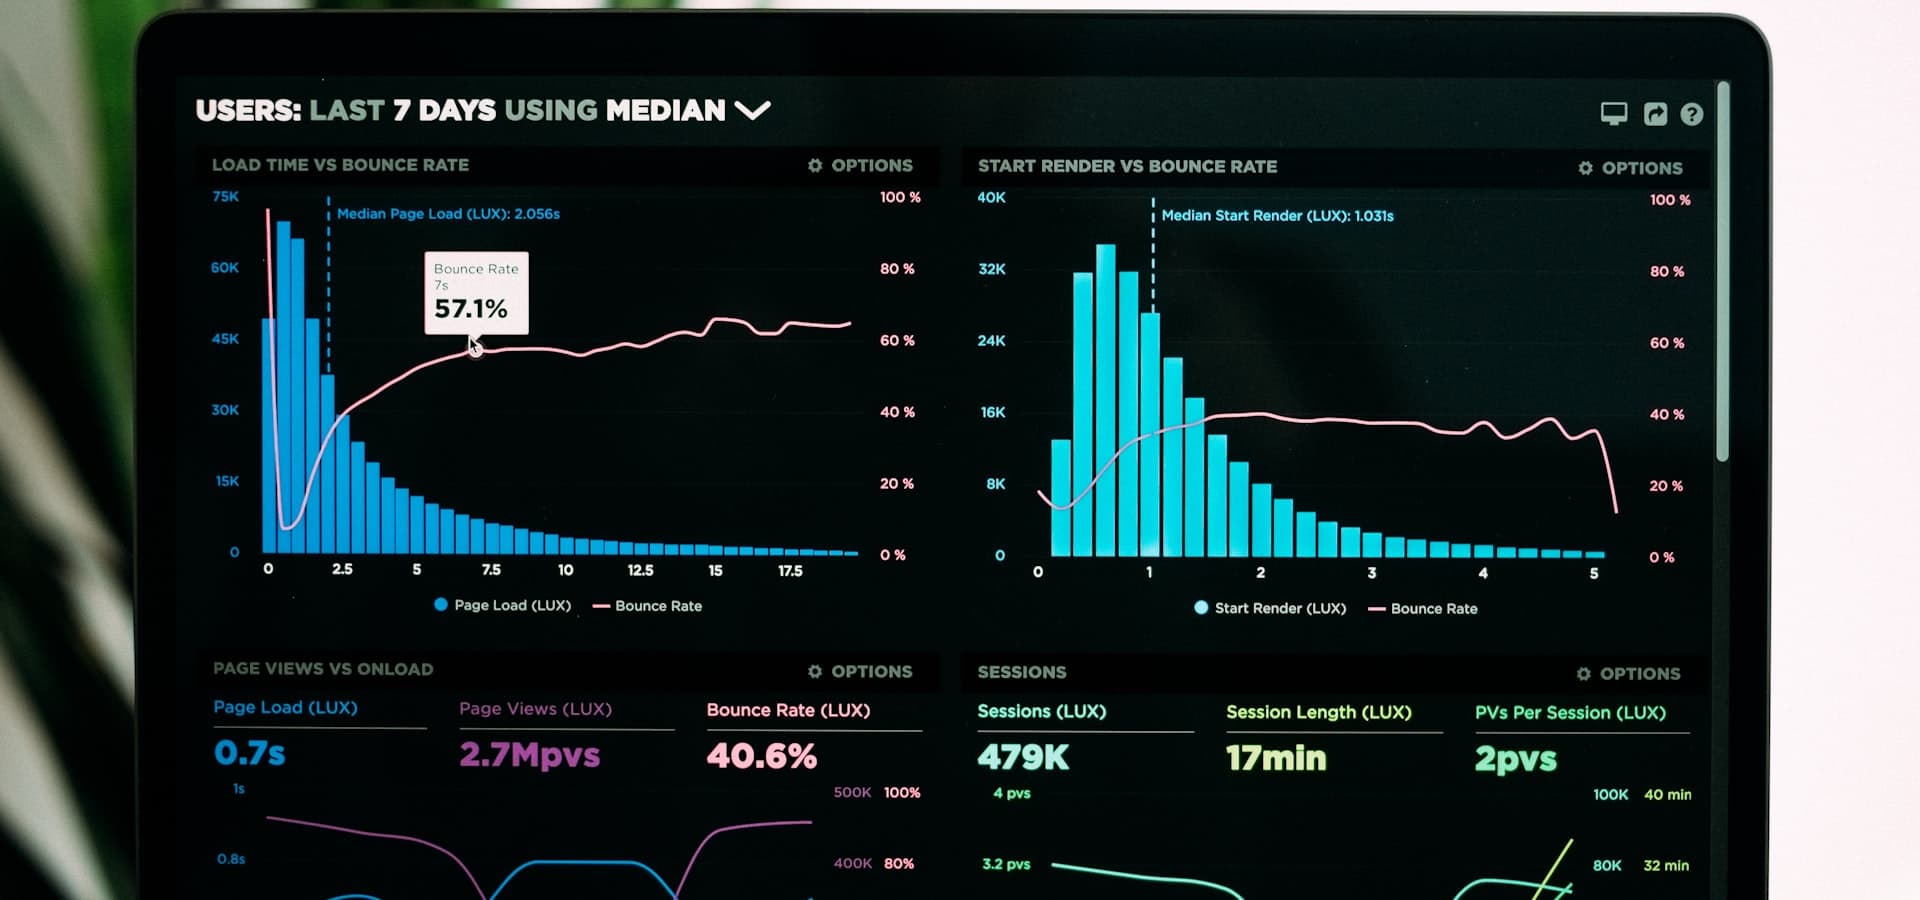
Financial Dashboards
Connected to Your Books. Updated Automatically.
We connect directly to your QuickBooks Online file and populate a full suite of financial dashboards: cash flow, P&L, balance sheet, and ratios. No exports. No manual work. No stale numbers.
The Problem
QuickBooks records your data. It doesn't tell you what it means.
QuickBooks Online is excellent at what it was designed to do: record transactions accurately. It was never designed to give you fast, intuitive answers to the questions you ask. Is cash going to be tight next month? Which service line is dragging margin? Are we on pace?
Getting those answers requires running multiple QBO reports, exporting to Excel, manually combining the data, and doing analysis your bookkeeper wasn't hired to do. Most business owners end up skipping it and making decisions on instinct instead of numbers.
We fix that by connecting directly to your QBO file and building a permanent layer of financial intelligence on top of it: dashboards that update automatically and are designed to be read in two minutes, not two hours.
See What We Build
Real Reports. Real Format.
These are the actual report types we deliver. Browse three of the core dashboards your team would use. All populated automatically from your QBO file.
| Cash Flows (YTD) | Connected to QuickBooks Online | Boardroom Vitals | ||||||||
| A | B | C | D | E | F | G | H | |
| 3 | Week | Week Ending | Beg. Cash | Receipts | Disbursements | Net Cash Flow | Ending Cash | Runway |
| 4 | 1 | May 1 | $318,000 | $412,000 | ($287,400) | $124,600 | $442,600 | 13.8 mo |
| 5 | 2 | May 8 | $442,600 | $156,800 | ($198,300) | ($41,500) | $401,100 | 12.5 mo |
| 6 | 3 | May 15 | $401,100 | $289,400 | ($214,200) | $75,200 | $476,300 | 14.9 mo |
| 7 | 4 | May 22 | $476,300 | $134,700 | ($312,800) | ($178,100) | $298,200 | 9.3 mo |
| 8 | 5 | May 29 | $298,200 | $387,600 | ($198,400) | $189,200 | $487,400 | 15.2 mo |
| 9 | 6 | Jun 5 | $487,400 | $241,300 | ($187,600) | $53,700 | $541,100 | 16.9 mo |
| 10 | 7 | Jun 12 | $541,100 | $178,900 | ($224,700) | ($45,800) | $495,300 | 15.5 mo |
| 11 | 8 | Jun 19 | $495,300 | $312,400 | ($198,200) | $114,200 | $609,500 | 19.0 mo |
| 12 | 9 | Jun 26 | $609,500 | $167,800 | ($278,900) | ($111,100) | $498,400 | 15.6 mo |
| 13 | 10 | Jul 3 | $498,400 | $298,700 | ($187,300) | $111,400 | $609,800 | 19.1 mo |
| 14 | 11 | Jul 10 | $609,800 | $143,200 | ($267,800) | ($124,600) | $485,200 | 15.2 mo |
| 15 | 12 | Jul 17 | $485,200 | $378,400 | ($198,700) | $179,700 | $664,900 | 20.8 mo |
| 16 | 13 | Jul 24 | $664,900 | $187,600 | ($212,400) | ($24,800) | $640,100 | 20.0 mo |
| 17 | YTD Total | $318,000 | $3,289,800 | ($2,966,700) | $322,100 | $640,100 | +6.2 mo | |
Google SheetsWeekly cash flow model auto-populated from your QBO file, one of 15+ core reports included in every engagement
Core Dashboards
Every engagement includes this full suite of standard reports, auto-populated directly from your QBO file. No setup required on your end; they're live within days.
Custom Reports
Beyond the core suite, we build reports specific to how your business runs: your industry, your org structure, your reporting audience.
Department & Location P&Ls
See exactly where margin is made (and where overhead is climbing), broken out by team, location, or cost center.
Industry-Specific KPIs
Retention rate, utilization, job costing, subscription MRR. Whatever your industry tracks, we build it into your dashboard.
Rolling Forecast & Scenario Models
A living forecast that updates monthly against actuals, with best/base/stress scenarios for planning conversations.
Board & Investor Reporting Packs
Clean, branded monthly or quarterly packages ready to send: no manual assembly, no stale numbers.
How It Works
From Your QBO File to Your Dashboard
Connect to QuickBooks Online
We connect directly to your QBO file with read-only access. Your data flows in automatically: no exports, no manual uploads, no spreadsheet maintenance.
Core Dashboards Go Live
Within days your full suite of 15+ standard reports is live and populated with your actual numbers: cash, P&L, balance sheet, and ratio dashboards all in one place.
We Build What's Custom
We configure additional reports and KPIs specific to how you run your business: industry metrics, department views, or board-ready output packages.
Monthly CFO Review
Our team reviews the dashboards with you monthly to surface insights, explain anomalies, and adjust the model as your business evolves.
Before Boardroom Vitals, I was flying blind on cash. Now I have dashboards that update automatically and I can answer any question my board asks in under 30 seconds.
CEO, $8M Professional Services Firm
Common Questions
Frequently Asked Questions
Get Started Today
See Dashboards Built for Your Numbers
Book a free walkthrough and we'll connect to a sample file and show you exactly what your core dashboards would look like: cash, P&L, balance sheet, and the reports specific to your industry.